

Suppose a manufacturing farm manufactures three products (Brand) say X,Y,Z and it has three sale points (Location) say A,B,C from where they sell those products.
They keep a track of selling Amount of each product from each sale point on year basis in the following table that looks like below:
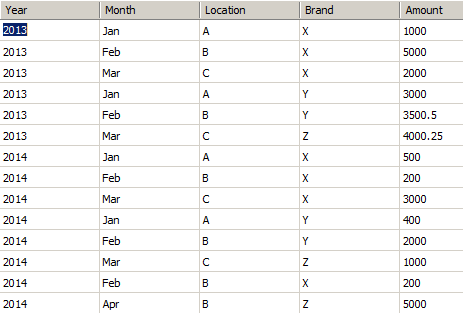
For the sake of simplicity I am keeping the schema very simple to understand. Each row in the diagram informs in which month of a year which Brand (product) got sold out from which Location and how much Amount is earned after selling that product.
Suppose it is required to find out how much amount of Product was sold out from each location on each Brand basis in the year of 2014 and on every month basis. So the matrix will look like as follows:
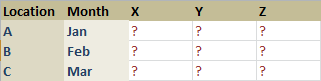
So we need to get the summation value of Amount sold for the intersection of Brand data points X, Y, Z to Location Data Points A, B, C and of Month Data points Jan, Feb etc.
So this is what pivoting means i.e. Intersection of data points to summarize the data.
Implementation
Pivot query basically has three parts. Considering the above table, let’s us understand this properly:
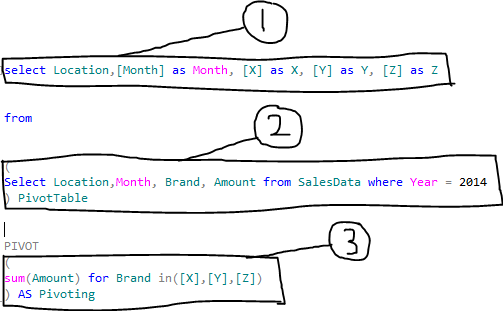
Part 1: It defines the actual data points of the table to be displayed as header. What data point is, has already been defined.
Part 2: This is the actual dataset from the table. Note that the column names of the table are given here to create the dataset as like usual simple query.
Part 3: This is the actual pivoting of the data.
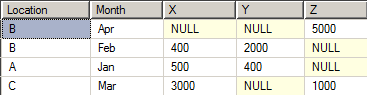
After execution of the above query we are able to find out the total sale of Brand X, Y, Z for the locations A, B, C in the year of 2014 per month basis and that looks like as follows:
Conclusion
In this blog I’ve basically tried to make you understand how we can use the Pivoting in SQL Server that gives the insight of data by rotating rows and columns of a table from multidimensional perspective. Forming the interactive parameterized query we are able to consume/display the direct returned pivot dataset without having any manipulation in DOT Net application, SSRS etc.