

Recently, I had a requirement where sales team wanted to present SharePoint List data as a Pie Chart in the Dashboard. The customer list had around 10K items.
Initially, thought of exporting the list contents to Excel and create a Pie Chart within Excel workbook. Display the same chart in SharePoint using Excel web part. This works well. But the issue is, if the source data changes, you need to update the excel. There is no direct sync between SharePoint list and the Pie Chart.
After some research, found that we can use Microsoft Power BI to analyze the list and build the chart. Office 365 App launcher has the web version of the Power BI. But after connecting to SharePoint list found that, web version works only with SharePoint document library, not with SharePoint Lists. It doesn’t even populate SharePoint lists while making a connection to SharePoint.
After some exploration found that, we can use combination of Desktop Power BI and web version of Power BI to integrate with SharePoint List.
So without much wasting time, lets begin.
Download the Desktop version of the Power BI. https://www.microsoft.com/en-us/download/details.aspx?id=45331
After installation, open the “Power BI Desktop” icon from your desktop.
Click on Sign In and Sign in with your office 365 credentials.
Click on Get Data and Select SharePoint Online List. Enter the Site URL.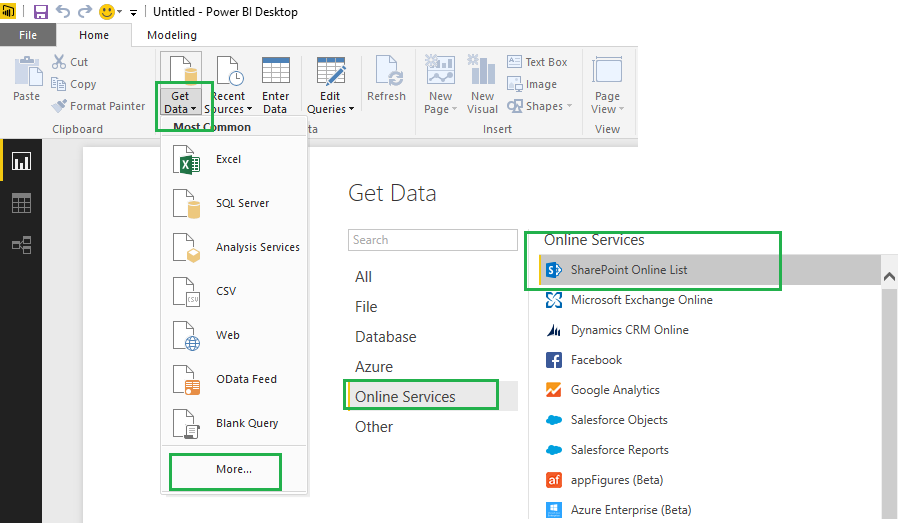
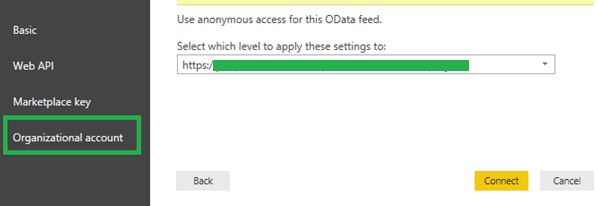
Select the appropriate login. In my case it is “Organizational Account”.
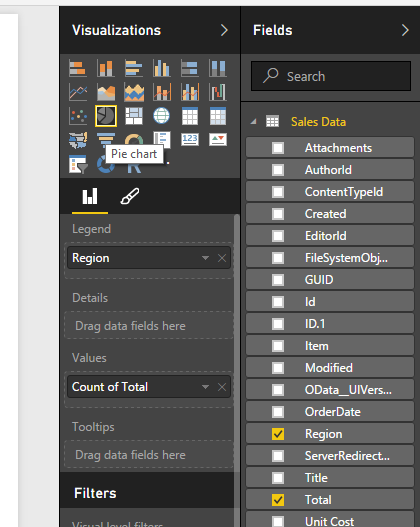
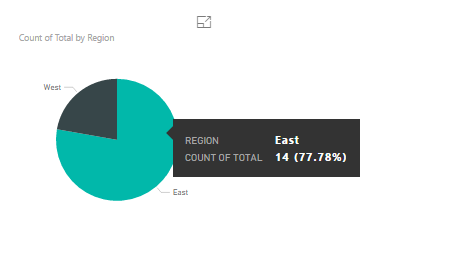
Select the List (in my case it is “Sales Data” List) from the display and click on Load Optionally, you can remove/manipulate the columns and its values based on the type of report you wish to have. In my example, I want to create a simple report of Count of Sales by Region.
On Visualisations, select the Pie Chart. Drag and drop the Parameters.
Save the file with extension pbix.
Click on Publish button on the Ribbon. This will push the Report and its Dataset to your Office 365 Power BI Version.
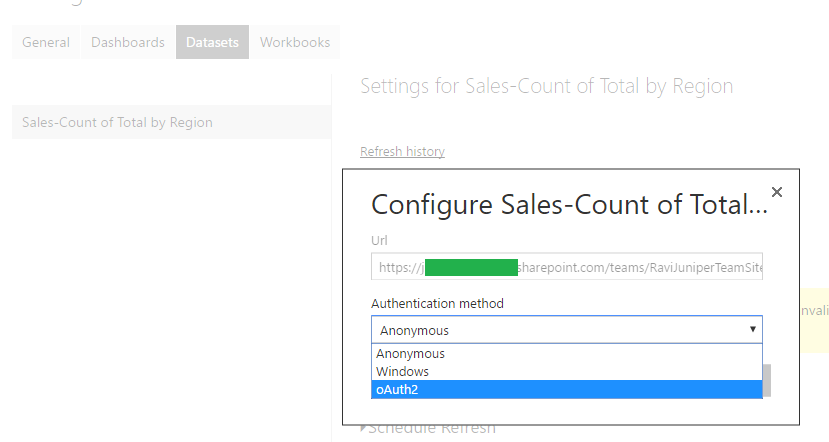
Once, it is uploaded to web version of Power BI, you need to update the connection and the Refresh duration
Update the Connection and Refresh Duration:
- In web Power BI version, click on the on the Data Connection, under Datasets.
- Under Data Source Credentials, click on Edit Credentials. Select OAuth2 and provide your credentials.
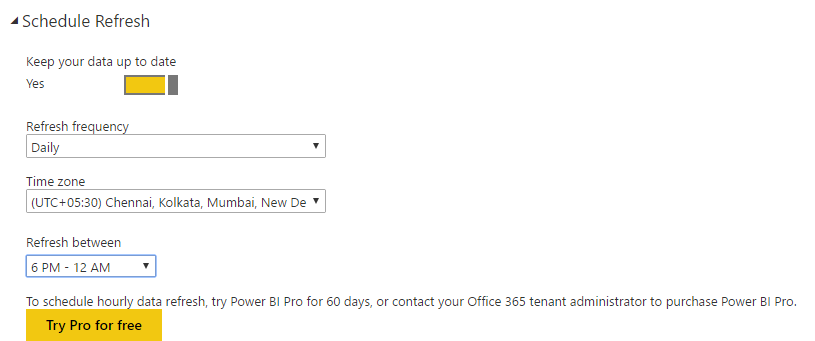
- Click on Schedule Refresh and make the changes.
Sharing:
There are 3 ways you can share the Report from Power BI
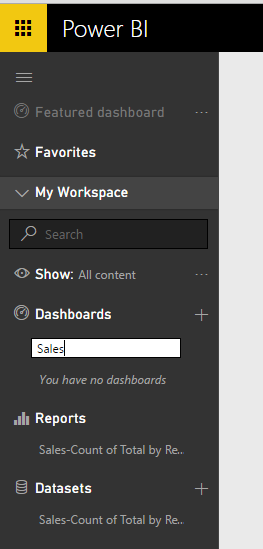
Share the Dashboard
Click on + sign under Dashboard and give a name.
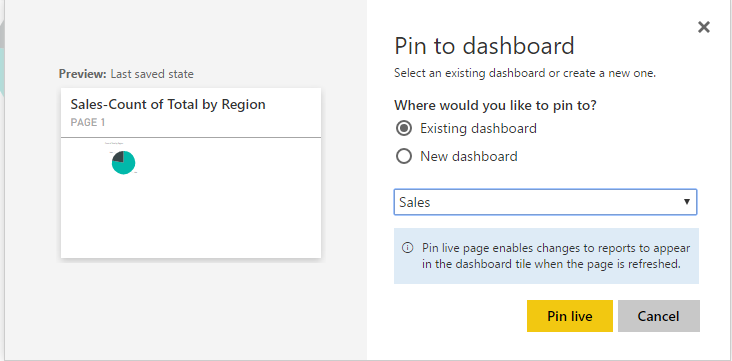
To add the Report, select the Report and click on “Pin Live” Page.
Select the Dashboard and click on Pin Live.
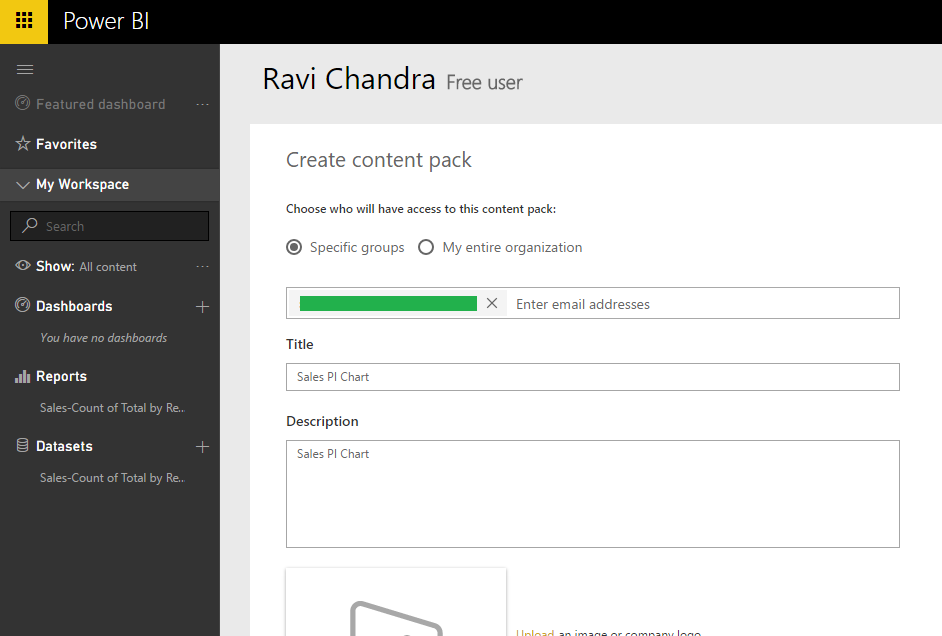
Share the Report via Content Pack:
Click on Gear icon and click on “Create Content Pack”
Give user email address, select the Report to you wish to share.
Share it via Public URL or via embedded URL:
Click on the Report and click on “Publish to web” in the File menu.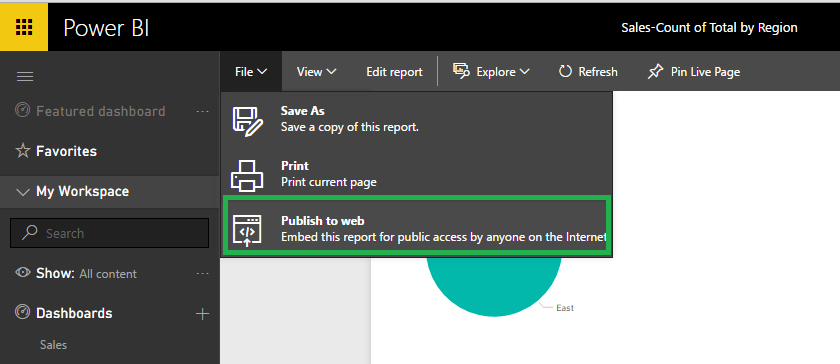
The popup will give you the direct URL or you can put the embed the code in Iframe.
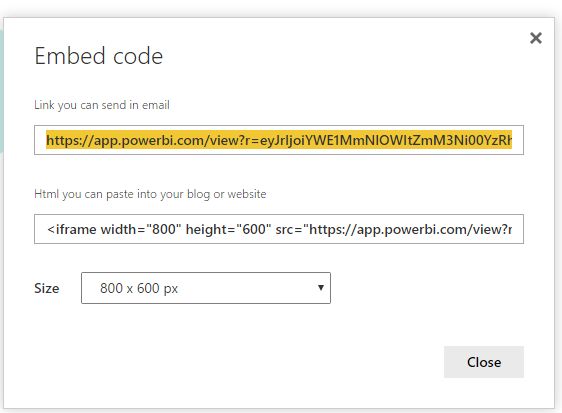
You can use this embed code in a SharePoint page to display the report.
Power BI here to stay in Microsoft eco-system and it is evolving every day. Power BI solution is designed to help business users gain insights from their data and visualise them in a self-service way. Like SharePoint 2016, Power BI can provide solutions in hybrid scenarios.
Hope this blog helps someone out there.
Thanks!
Ravi


Yes this has been useful. One thing that isn’t obvious is being to resolve users ( Modifed , Created etc) once I have surfaced my Online list in Powerview.