
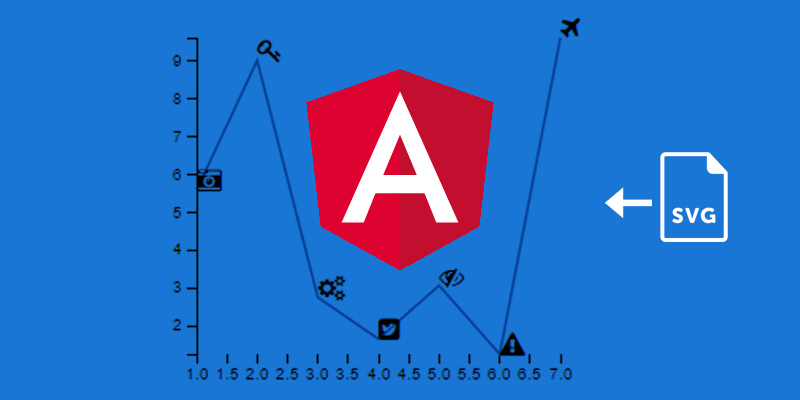
Many times an Angular Project might have the requirement to show reports in the form of graphs.You can use D3 to support these features. Using D3 you can draw different types of charts like Bar Charts, Pie Charts, Line Charts etc.
For Line Charts data points can be represented using dots, circles, triangles, gradients etc which can be easily done. But sometimes, there might be requirements to show custom images at data points in line charts. So, let me discuss a few ways of doing so.
Different ways of adding custom images to D3 line charts:
Adding SVG as HTML
In this approach we prepare a HTML snippet for the SVG Image. This HTML from SVG image can easily be generated from many available online tools like convertio.
Once you have the HTML for the SVGimage you can use that to add to line chart as shown in the below code snippet:
.html File:
<svg width="100%"style="overflow: hidden;">
<g app-sampleid="app-div"></g>
</svg>
.ts File:
let svgImage='<g><g><path style="fill-rule:evenodd;clip-rule:evenodd;fill:#EA700D;" d="M10.2,32.4h20.2c1.4,0,2.5-1.1,2.5-2.5V11.1c0-1.4-1.1-2.5-2.5-2.5H10.2c-1.4,0-2.5,1.1-2.5,2.5v18.7 C7.7,31.2,8.8,32.4,10.2,32.4L10.2,32.4z"/><g class="st1"><path style="fill:none;stroke:#EA700D;stroke-width:1.7638;stroke-linecap:round;stroke-linejoin:round;stroke-miterlimit:10;" d="M10.2,32.4h20.2c1.4,0,2.5-1.1,2.5-2.5V11.1c0-1.4-1.1-2.5-2.5-2.5H10.2c-1.4,0-2.5,1.1-2.5,2.5v18.7 C7.7,31.2,8.8,32.4,10.2,32.4L10.2,32.4z"/><g class="st3"><g class="st4"><g class="st5"><path style="fill:#FFFFFF;" d="M17.2,30.5c-0.7-0.3-1-0.9-1-1.7c0.1-1.8,0-3.6,0-5.4c0-0.2,0-0.3,0-0.5c0.8,0.6,1.7,1.1,2.6,1.8 c0,1.4,0,3,0,4.5c0,0.6-0.4,0.9-0.9,1.2C17.7,30.5,17.5,30.5,17.2,30.5L17.2,30.5z"/><path style="fill:#FFFFFF;" d="M20.9,30.5c-0.7-0.4-0.9-1-0.9-1.8c0.1-1.3,0-2.5,0-3.8c0.9-0.1,1.7-0.2,2.6-0.3c0,0.8,0,1.7,0,2.6 c0,0.5,0,1.1,0,1.6c0.1,0.8-0.2,1.4-1,1.7C21.4,30.5,21.1,30.5,20.9,30.5L20.9,30.5z"/><path style="fill:#FFFFFF;" d="M19.9,9.6c0.6,0.2,1.2,0.6,1.4,1.3c0.4,1-0.1,2.1-1.1,2.5c-1,0.4-2.1-0.1-2.5-1c-0.4-1,0-2.1,0.9-2.5 c0.1-0.1,0.3-0.1,0.4-0.2C19.3,9.6,19.6,9.6,19.9,9.6L19.9,9.6z"/><path style="fill:#FFFFFF;" d="M25,21.6c1.5,1.5,3,3,4.4,4.4c0.5,0.5,0.4,1.3-0.1,1.8c-0.5,0.5-1.3,0.5-1.8,0.1c-1.5-1.4-3-2.9-4.4-4.4 c-2.7,1.4-5.3,0.2-6.5-1.5c-1.3-1.9-1.1-4.5,0.6-6.2c1.6-1.7,4.3-1.9,6.2-0.6C25.1,16.2,26.4,18.7,25,21.6L25,21.6z M24.5,19.1c0-2.1-1.7-3.8-3.8-3.8c-2.1,0-3.8,1.7-3.8,3.8c0,2.1,1.7,3.8,3.8,3.8S24.5,21.3,24.5,19.1L24.5,19.1z"/><path style="fill:#FFFFFF;" d="M17.4,14.4c-0.5,0.7-1.1,1.4-1.7,2c-0.1,0.1-0.3,0.2-0.4,0.2c-1.1,0-2.2,0-3.2,0c-0.8,0-1.2-0.5-1.2-1.2 c0-0.6,0.5-1,1.2-1c1.7,0,3.3,0,5,0C17.2,14.4,17.3,14.4,17.4,14.4L17.4,14.4z"/><path style="fill:#FFFFFF;" d="M24,14.4c1,0,2.1,0,3.2,0c0.5,0,0.9,0.5,0.9,1c0,0.5-0.3,1-0.8,1.1c-0.5,0.1-0.9,0.1-1.4,0.1 c-0.1,0-0.2-0.1-0.3-0.2C25.1,15.7,24.5,15,24,14.4L24,14.4z"/><path style="fill:#FFFFFF;" d="M22.6,19.2c0,0.7,0,1.3,0,2c0,0.2-0.1,0.5-0.3,0.6c-1.2,0.8-2.9,0.5-3.9-0.5c-1-1.2-1-2.9-0.1-4 c1-1.1,2.6-1.4,3.9-0.7c0.3,0.2,0.4,0.3,0.4,0.7C22.6,17.9,22.6,18.5,22.6,19.2L22.6,19.2z"/></g></g></g></g></g></g>';
this.chart = d3.select("#app-div");//container in html file
this.chart.selectAll(".icons")
      .data(this.dataset)// data for graph plotting
.enter().append('svg')
.attr("x","50")
.attr("y","-17")
.attr("height","32")
.attr("width","32")
.attr("viewBox","0 0 40 40")
     .html(svgImage)
.attr('class', 'x-axis-arrow')
As shown above you can add the SVG HTML to the line chart using:
.html(svgImage)
You need to add innersvgpolyfill in your angular project to make this work in IE. It can be found in this link https://github.com/dnozay/innersvg-polyfill/blob/master/innersvg.js
You can add this as separate file and import it or directly add the functions to your .ts file as shown below:
setInnerSVGPolyfill() {
var serializeXML = function(node, output) {
var nodeType = node.nodeType;
if (nodeType == 3) { // TEXT nodes.
// Replace special XML characters with their entities.
output.push(node.textContent.replace(/&/, '&').replace(/</, '<').replace('>', '>'));
} elseif (nodeType == 1) { // ELEMENT nodes.
// Serialize Element nodes.
output.push('<', node.tagName);
if (node.hasAttributes()) {
var attrMap = node.attributes;
for (var i = 0, len = attrMap.length; i<len; ++i) {
var attrNode = attrMap.item(i);
output.push(' ', attrNode.name, '=\'', attrNode.value, '\'');
}
}
if (node.hasChildNodes()) {
output.push('>');
var childNodes = node.childNodes;
for (var i = 0, len = childNodes.length; i<len; ++i) {
serializeXML(childNodes.item(i), output);
}
output.push('</', node.tagName, '>');
} else {
output.push('/>');
}
} elseif (nodeType == 8) {
// TODO(codedread): Replace special characters with XML entities?
output.push('<!--', node.nodeValue, '-->');
} else {
// TODO: Handle CDATA nodes.
// TODO: Handle ENTITY nodes.
// TODO: Handle DOCUMENT nodes.
throw'Error serializing XML. Unhandled node of type: ' + nodeType;
}
}
// The innerHTML DOM property for SVGElement.
Object.defineProperty(SVGElement.prototype, 'innerHTML', {
get:function() {
var output = [];
var childNode = this.firstChild;
while (childNode) {
serializeXML(childNode, output);
childNode = childNode.nextSibling;
}
returnoutput.join('');
},
set:function(markupText) {
// Wipe out the current contents of the element.
while (this.firstChild) {
this.removeChild(this.firstChild);
}
try {
// Parse the markup into valid nodes.
var dXML = newDOMParser();
//dXML.async = false;
// Wrap the markup into a SVG node to ensure parsing works.
var sXML = '<svgxmlns=\'http://www.w3.org/2000/svg\'>' + markupText + '</svg>';
var svgDocElement = dXML.parseFromString(sXML, 'text/xml').documentElement;
// Now take each node, import it and append to this element.
var childNode = svgDocElement.firstChild;
while(childNode) {
this.appendChild(this.ownerDocument.importNode(childNode, true));
childNode = childNode.nextSibling;
}
} catch(e) {
thrownewError('Error parsing XML string');
};
}
});
// The innerSVG DOM property for SVGElement.
Object.defineProperty(SVGElement.prototype, 'innerSVG', {
get:function() {
returnthis.innerHTML;
},
set:function(markupText) {
this.innerHTML = markupText;
}
});
};Pros:
- This works in all browsers including IE.
- The html generated is very accurate and resembles the SVG image.
Cons:
- Sometimes for very complex SVG images generation of HTML can be tricky. Also generated HTML might have some tags which are not compatible with D3 chart. You must remove those unnecessary HTML tags to make it work.
Adding SVG as font
In this approach you need to generate font from an SVG image using tools like glyphter and add that font file to font folder in your angular project. The font would have a class name and you can access this font in the D3 graph by adding the font class to an xhtml tag inside foreign object tags as shown below:
this.chart = d3.select("#app-div");//container in html file
this.chart.selectAll(".font-icon")
      .data(this.dataset)// data for graph plotting
.enter().append('foreignObject')
.append('xhtml:span')
.attr('class', 'font-icon)
.style("background-color", "#EA700D")
.style("border-radius", "5px")
.style("padding", "2px")
.style("color", "#ffffff")
.style("font-size", "20px")
.style("width", "20px")
.style("height", "21px")
.style("display", "block")
.attr("width", 30)
.attr("height", 30)
‘font-icon class is the font file reference which you need to add to xhtml in foreign object.
Pros:
- Generated font files do not need to be modified for usage in D3 charts
Cons:
- IE does not support foreign objects. So, this approach will not work in IE.
- The font generated image is not as accurate as the real SVG image. It misses the details.
Adding reference to SVG Image by keeping it in a path
In this approach we need to keep the image in a pathand then access this image using xlink:href as shown below:
this.chart.selectAll(".icon")
  .data(this.dataset)// data for graph plotting
.enter().append("image").attr("xlink:href", "https://github.com/favicon.ico")
.attr("width", 16)
.attr("height", 16)
.attr("class", "dot")
.style("stroke", "red")
Pros:
- Very easy to implement. No code conversions are needed.
Cons:
- Sometimes while integrating to customer end the customer does not allow to add extra image files and if for some reason the files are not copied to correct location then it won’t work.
- This approach has some glitches in some versions of IE and Firefox.


Hi, I’m trying to add a svg as nodes in a graph, and I’m want to use the path as you show in this example. Could you be able to help me?