
In my previous article I have provided the instructions about how SharePoint list(s) can be imported into Excel using OData Feed option, and how it helps in real-time consumption of the data when the report is uploaded to SharePoint.
This is the second part of this article series. In this part I will provide the instructions about How to create the BI report using the data imported into Excel.
If you have directly landed on this page, then it is recommended that you follow the instructions from my previous article Excel for BI Reporting and Publishing Through SharePoint and understand the steps to import the SharePoint list(s) into excel using OData feed.
Let us consider a simple business use case for a fictitious company named Northwind and create a sales analysis dashboard report.
As explained in my previous article, For the demo purpose I have used the tables from Northwind DB and re-created each table as lists and populated them with dummy data. If you need to understand about the DB structure and explanation about each tables of Northwind DB, please refer to this article here.
In this article I will create a Dashboard report to display the pivot charts with a simple example. This Pivot chart thus created will get the data from the lists within SharePoint. The instructions below will take you through the steps to connect the list(s) using PowerPivot option in excel.
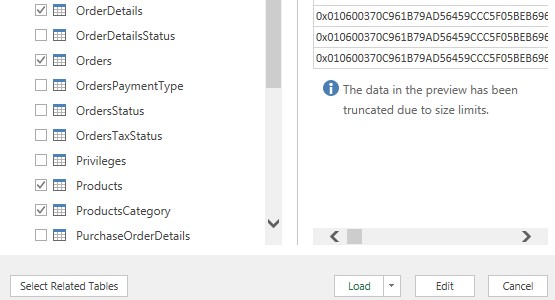
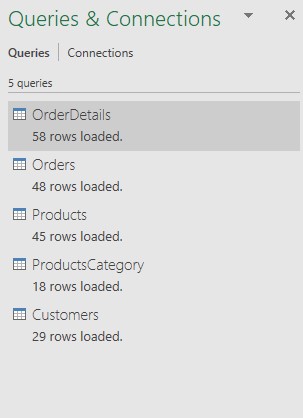
As per the instructions from my previous article, I am importing the lists OrderDetails, Orders, Products and ProductsCategory.
- select the List(s) and then click on the Load Button
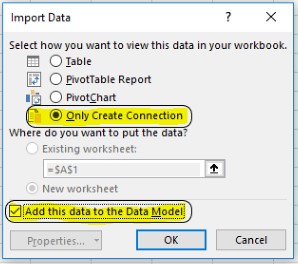
- In the next screen select the options as highlighted in the picture below and click on OK.
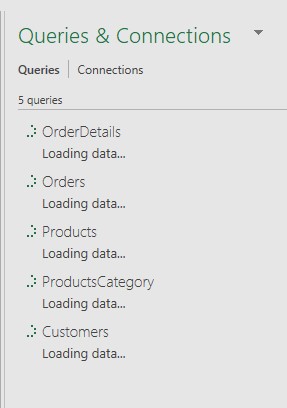
- You will be presented with the screens below. One showing the progress of import and one after the import is completed.
- Now when you open the excel file you will see the blank sheets, this is because we have opted to use the connection while loading and not to load the list data directly to excel sheets.
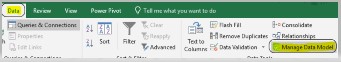
- Now, to see the data and build the queries and relationships between the list(s), you need to click on Data tab in the ribbon bar and then click on Manage Data Model as highlighted in the picture below.
- You will be presented with the PowerPivot window as shown in the picture below.
Note : Please Refer to Get started with Power Pivot in Microsoft Excel to understand in detail about PowerPivot.
Excel for BI Reporting and Publishing Through SharePoint.
This is the place where the custom calculated columns can be added and the relations between the list(s) can be established.
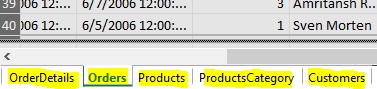
- The PowerPivot contains one tab each for each of the imported list(s) as depicted in the picture below.
Add New Column and Formulae
For my business use case, I will be adding a custom column in Order Details list with the name “Total Cost” and the calculate the total cost by multiplying UnitPrice of the item and the total quantity.
Perform the steps below to execute this action.
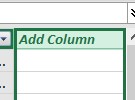
Step 1 : Scroll to the extreme right and identify the blank column with the name add column.
Step 2 : Right click on the column heading and then Click on Rename column.
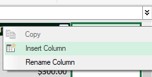
Step 3 : Now you can add the Formulae as shown below.

Establish the Relation between the imported SharePoint list(s)
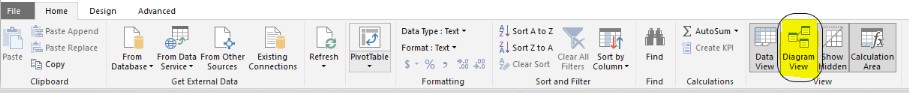
- Click on a Diagram View in the ribbon bar.
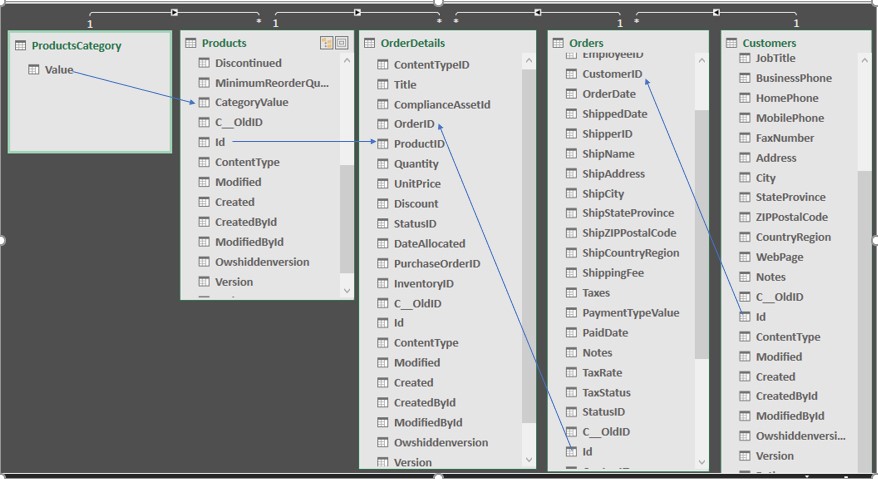
- In the Diagram view One to many relationship can be established by dragging and the Primary Key from one list into the foreign key of another list.
Create the Dashboard
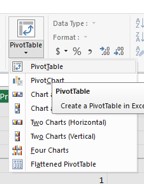
- Next step is to create the Dashboard, to do so Click on the Pivot table button in the ribbon bar and select the option of your choice.
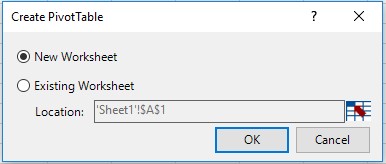
- You will have to select either you would like to create PivotTable on New Worksheet or Existing Worksheet.
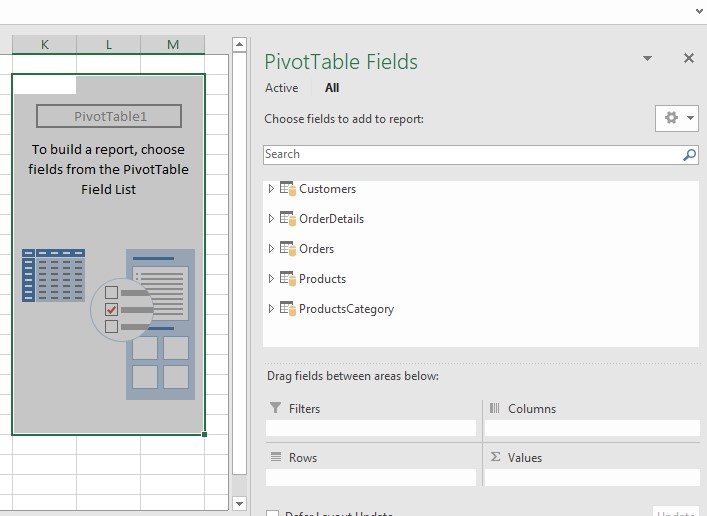
- All the connected list(s) will be displayed under PivotTable Fields section, and you can create the required Chart(s) as per your requirement.
- Now you can generate the Pivot charts as per your business requirement.
- Based on my business use case I have mentioned in the beginning of this article, I have created the simple Dashboard as shown in the picture below.
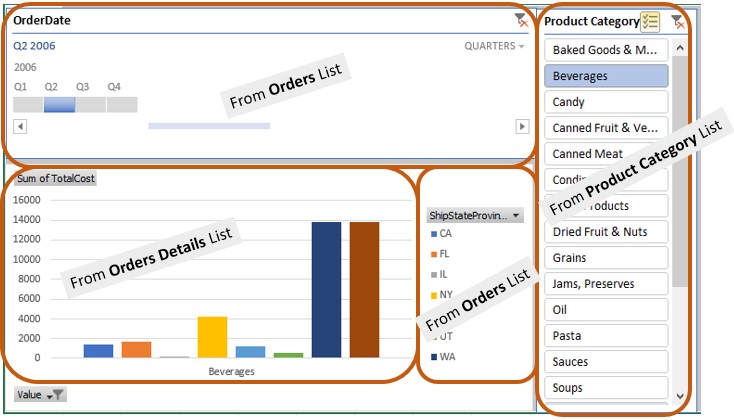
As you can notice in the picture above, the data source of each sections is from different list(s) of SharePoint.
In the next part of this article series I will be discussing about “How to Upload this excel based BI report to SharePoint and then explore the various options to publish and consume through SharePoint.